How to create.....?
We all love to build our best dashboards, reports or almost app like experiences. Sometimes this needs some creative thinking along the way. On this page I will share my creative solutions and explore the steps I took before my final results are ready for use.
How to create a Stacked Clustered Column Chart in PowerBI?
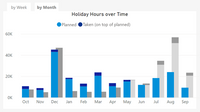
A few Weeks ago a client asked me to change an existing stacked column chart. What the client wanted, was to see the stacked actuals and the stacked actuals last year. So in fact the client wanted a stacked clustered column chart. As we all know this isn’t a standard visual in PowerBI, so I had to come up with a solution.
The final result is made, with 2 standard stacked column chart visuals on top of each other.
The final result you can see in the picture below. To make it more complex my client needed to plot the chart by week or by month.
Interest on how I created this click 'Read more' for a step by step guide.
How to create a report with Dynamic Hierarchy Presentation
Have you ever been asked or wondered if it's possible to dynamically present a hierarchy level in a visualization based on a selected value in a slicer in Power BI?
I have created a solution for this, which can be used in various visualizations and can also be adapted for other scenarios with some modifications.
Let's start with a bit of context. My fellow Microsoft BI developers who have been working with Microsoft BI products for a while may still remember the MDX function "currentmember.level.ordinal" in MOLAP cubes. This function allows us to determine the level in a hierarchy of the value selected in a filter. With this information it's then possible to calculate a measure differently or dynamically present a different level from the hierarchy in a visualization using expression functions in SSRS.
Unfortunately, for us Power BI enthusiasts, we don't have a similar function in DAX. For this reason, I took the functional aspects of MDX as a starting point to see what is possible in DAX in combination with the data model.
Interest on how I created this just click 'Read more' .

